What Are Core Web Vitals? LCP, INP, and CLS Metrics
When some URLs are rated “poor” in the Core Web Vitals report in Google Search Console, that is a meaningful signal about the site’s overall performance. Those results, however, cannot always be explained by server infrastructure or page load speed alone. Assessing the various technical factors that shape user experience alongside Google’s measurement method is critical to identifying the real source of the problem.
Core Web Vitals are the three core metrics Google uses to evaluate page experience through real user data. This guide covers the metrics and thresholds in force as of 2026, and how the data in the reports should be interpreted.
What Are Core Web Vitals?
Core Web Vitals are three core metrics that measure how a web page is experienced by real users: LCP, which reflects load speed; INP, which reflects how quickly the page responds to user interactions; and CLS, which reflects how much visual elements shift while the page loads.
The decisive phrase in that definition is “real users”. Core Web Vitals do not measure performance in a development environment; they measure the actual experience of the site as it is visited across different devices and network conditions. Tests run over a corporate network connection do not represent the experience of a user on a mobile network with a low-end device.
Google runs the assessment at the 75th percentile. If 75% of users experience the page below the threshold value, it is classified as “good”. Using a percentile instead of an average is a deliberate choice; averages tend to hide the segment of users having the worst experience.
Core Web Vitals Metrics and Thresholds in 2026
| Metric | What It Measures | Good | Needs Improvement | Poor |
|---|---|---|---|---|
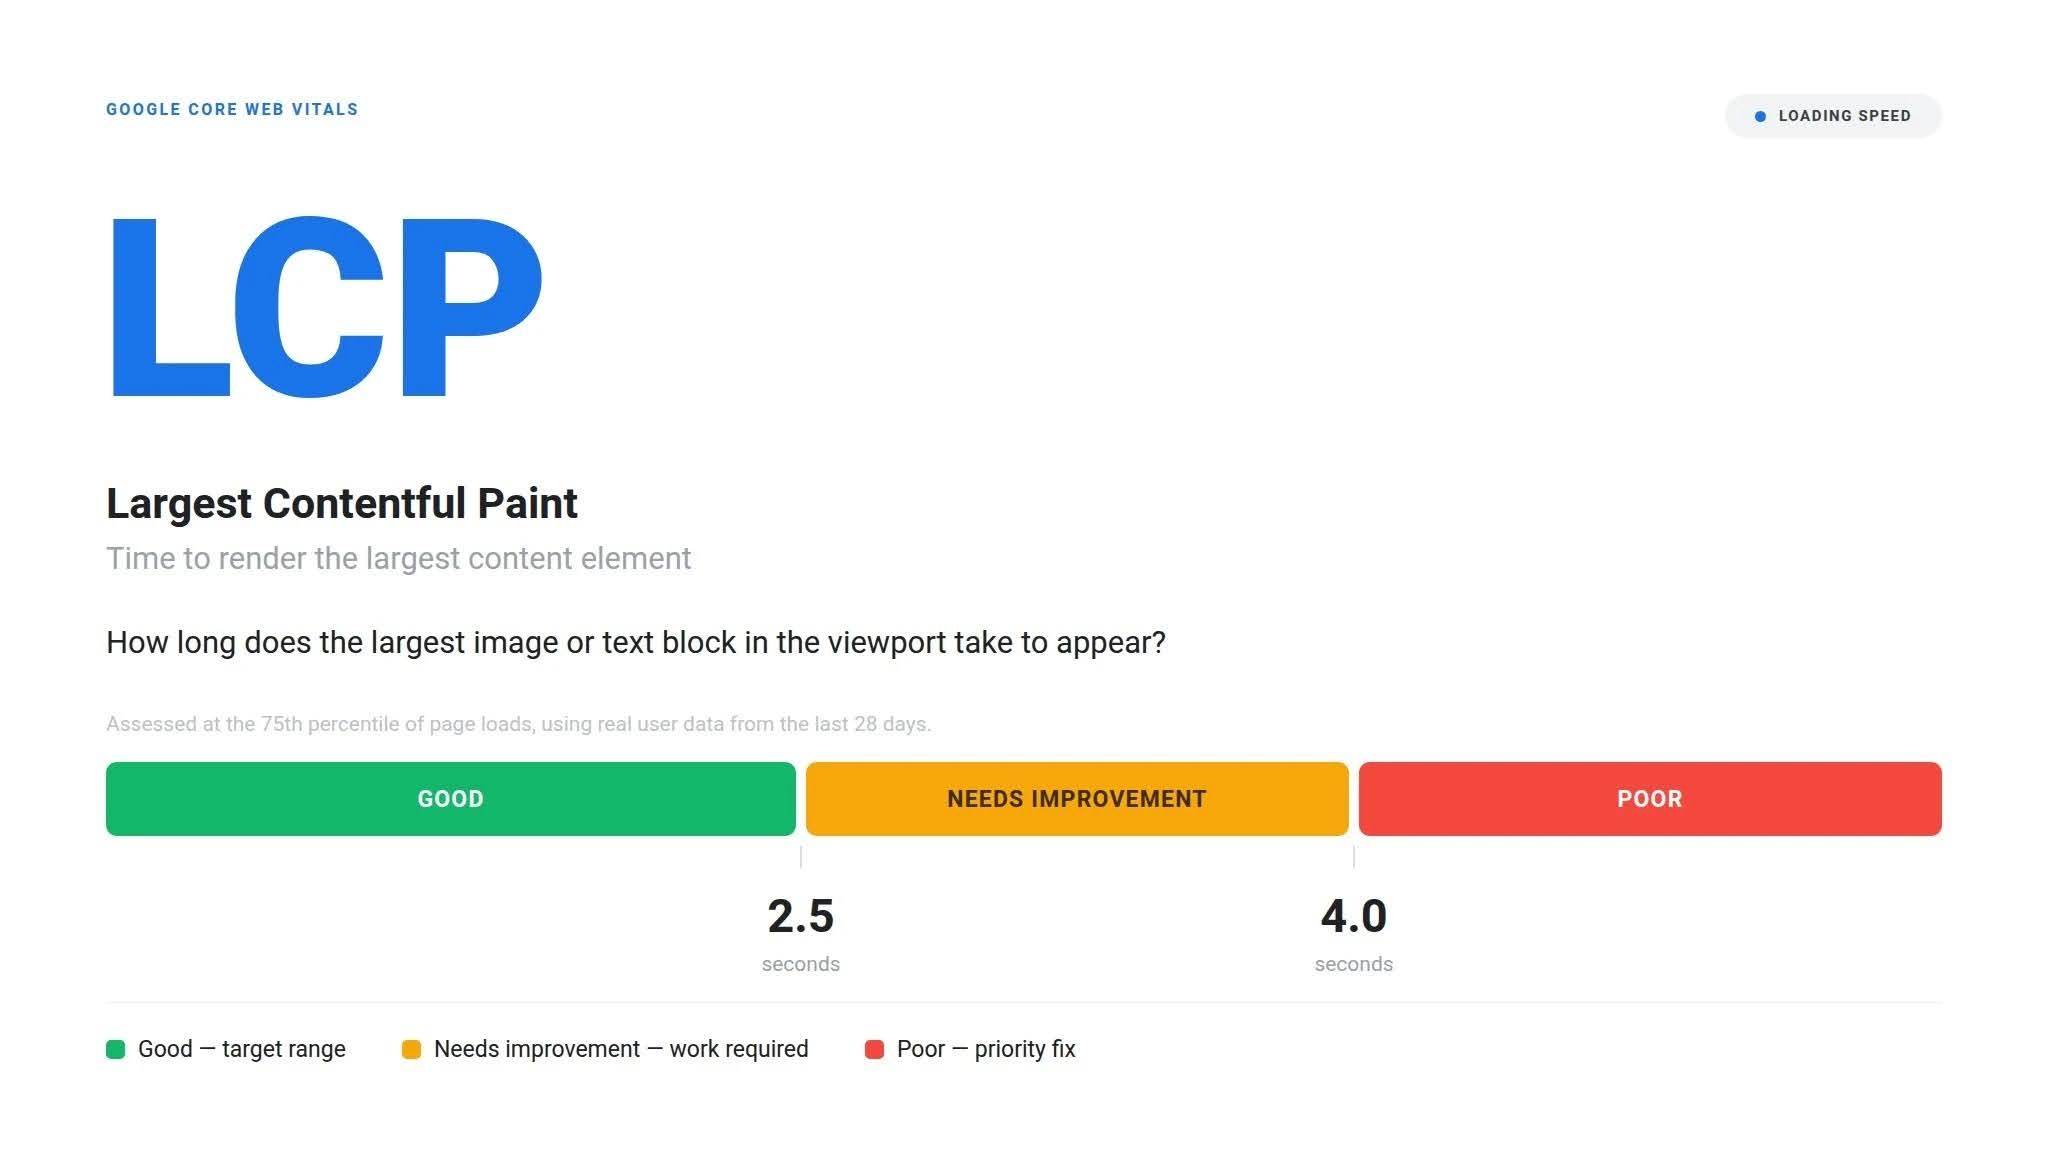
| LCP (Largest Contentful Paint) | Loading performance | ≤ 2.5 s | 2.5 – 4.0 s | > 4.0 s |
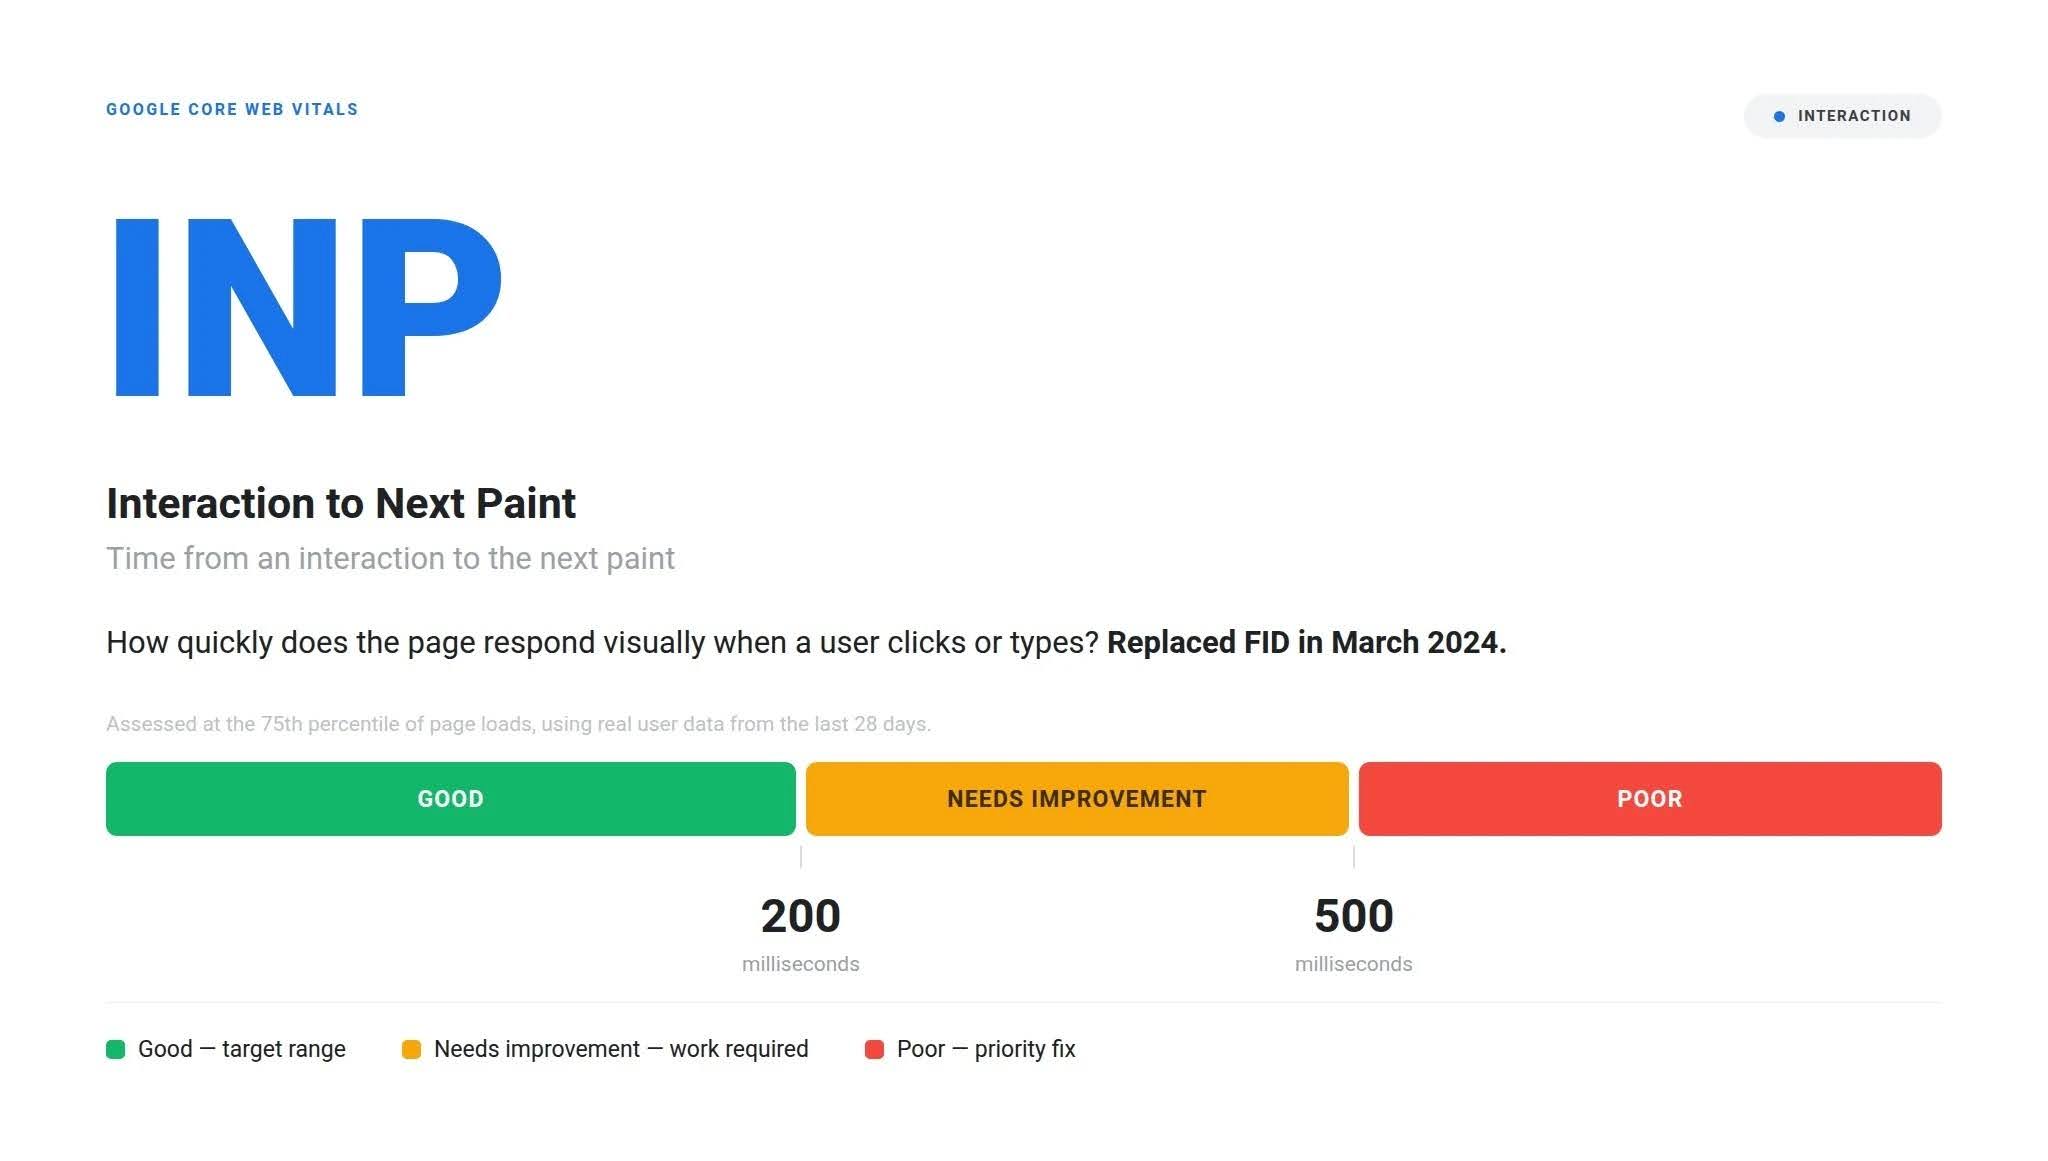
| INP (Interaction to Next Paint) | Interaction speed | ≤ 200 ms | 200 – 500 ms | > 500 ms |
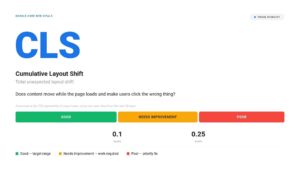
| CLS (Cumulative Layout Shift) | Visual stability | ≤ 0.1 | 0.1 – 0.25 | > 0.25 |
For a page to be classified as “good”, all three metrics must meet their threshold. If two metrics hit the target and one does not, the page is assessed in the poor group.
What Is Largest Contentful Paint (LCP)?
LCP is the moment the user perceives the page as loaded. When this takes longer, the exit rate before content is even seen goes up.
LCP measures the time it takes for the largest content element in the viewport to be painted on screen. That element is usually a hero image, a product photo or a large block of text. Target value: 2.5 seconds or less.
Three common factors that stretch out LCP:
- High server response time. The browser cannot begin painting before it receives the HTML document. This is the component most often overlooked.
- Late discovery of the LCP element. If the image is defined inside CSS or injected with JavaScript, the browser notices the element late.
- Render-blocking resources. Large CSS files and synchronous JavaScript loaded at the top of the document delay painting.
What Is Interaction to Next Paint (INP)?
INP is the moment the user perceives the interface as slow. Delay in actions such as filtering or adding to cart creates losses in the middle of the conversion funnel.
INP measures the response times of all interactions with the page (clicks, taps, keyboard input) and reports a result close to the worst of them. What is measured is the time until a visual change appears on screen after the interaction. Target value: 200 milliseconds or less.
Why Was FID Removed? What Does the Move to INP Mean?
Until 2024 the interaction metric was First Input Delay (FID). FID measured only the first interaction on the page, and only the delay before processing began, without covering how long the work took to complete. Those two limitations made the metric overly optimistic; pages met the threshold easily while performance problems persisted in real use.
Three practical consequences of the change:
- A page that meets the FID threshold may not meet the INP threshold. Many sites moved into the poor group after the metric changed.
- Optimising the first interaction is not enough; every interaction over the lifetime of the page is included in the measurement.
- The set of fixes is different. Deferring JavaScript was enough for FID in most cases, whereas INP requires breaking up long tasks on the main thread.
What Is Cumulative Layout Shift (CLS)?
CLS is what happens when the interface element you were aiming for moves at the last moment. It leads to mis-clicks and abandoned actions.
CLS measures unexpected shifts of visual elements while the page loads. Scoring is based on the size of the shifting area multiplied by the distance it moves. Target value: 0.1 or less.
The main sources: images without defined dimensions, ad slots that load late, cookie notices injected afterwards, and text reflowing once a web font loads.
How Do Core Web Vitals Affect SEO and Conversion?
The question has to be assessed on two separate layers. Most content in the industry overstates the first layer and leaves the second out of scope.
- Ranking impact. Google states that it evaluates Core Web Vitals as part of its page experience signals. Keeping expectations realistic matters, though: Core Web Vitals will not lift a page with insufficient content quality into the top results. The metric acts as a differentiator between pages that are close to one another in content quality and search intent match. Its effect is meaningful on highly competitive queries.
- Conversion impact. Commercially this is the decisive layer, and it is far more clearly measurable than the ranking effect:
- On slow-loading pages, users leave before seeing the content. That loss does not show up in organic traffic data; it shows up in revenue.
- Slow interactions (INP) do their damage in the middle of the funnel: filtering, adding to cart and form completion.
- Shifting layouts (CLS) cause mis-clicks; the impact on mobile devices is markedly higher than on desktop.
This effect can be measured rather than estimated. Segmenting users in your analytics tool by LCP value (below and above 2.5 seconds) and comparing the conversion rate of each segment gives you a measurable basis for justifying a technical improvement budget internally.
How Are Core Web Vitals Measured?
Measurement is the stage where most mistakes happen. Using a tool for something it was not designed for keeps teams focused on the wrong priorities for long stretches.
| Tool | Data Type | What It Is Used For |
|---|---|---|
| Google Search Console | Field (CrUX) | Seeing the real state that affects rankings |
| PageSpeed Insights | Field + Lab | Examining a single URL with both real and test data |
| Lighthouse / DevTools | Lab | Debugging during development |
| Chrome UX Report (CrUX) | Field | Competitor comparison and trend analysis |
| RUM (real user monitoring) | Field | Continuous monitoring and segment-level analysis |
The Difference Between Field Data and Lab Data
The most frequent question is this:
“Our PageSpeed Insights score is 95, yet Search Console reports the pages as ‘poor’. Which data should we go by?”
Both sources are correct; they rest on different measurement methods.
- Lab data: a one-off simulation carried out in a controlled environment. Lighthouse loads the page once with a defined device and network profile. Because it is repeatable, it is the preferred option during debugging.
- Field data: anonymous measurements collected from Chrome users who visited the site within the last 28 days. It is aggregated in the Chrome User Experience Report (CrUX) dataset and presented at the top of Search Console and PageSpeed Insights.
The decisive point is this: Google uses field data in its search systems. Even with a lab score of 100, field data will come back poor if a significant share of users are on weak network conditions.
Three working rules follow from that:
- Decisions should be based on Search Console data, not on the lab score.
- Diagnosis should be done in DevTools; field data does not show the source of the problem at line level.
- The top section of PageSpeed Insights shows the current state, the lower section shows the direction for improvement. The 0–100 score is not a Core Web Vitals metric.
The Google Search Console Core Web Vitals Report
The process should start with this report. It groups URLs into similar page sets and gives status information for each group, split by mobile and desktop. Working at group level rather than URL by URL is the better approach; a fix made on one product detail template affects thousands of URLs at once.
PageSpeed Insights, Lighthouse and DevTools
- PageSpeed Insights: the most practical tool for examining a single URL. Assess the field data first, then the lab findings.
- Lighthouse: the tool for the development stage. It makes the effect of a change visible immediately.
- The DevTools Performance panel: the most thorough tool for diagnosing INP. Long tasks, scripts occupying the main thread and post-interaction paint delay are all analysed here.
Continuous Monitoring: Why a One-Off Measurement Is Not Enough
Field data is calculated from a rolling 28-day window. That has two consequences:
- It takes weeks for a fix to appear in Search Console. An assessment made the next day produces a premature result.
- Regressions (a new script added on the marketing side, for example) also surface with the same delay, and by then root cause analysis is harder.
Core Web Vitals is therefore not a project but a process that requires continuity. Without a pre-release performance check and a continuous monitoring setup, improved metrics return to their earlier levels before long.
A practical starting point: begin with the changes that combine high impact with low effort reducing server response time, setting explicit dimensions on images and ad slots, deferring non-critical JavaScript, and preloading the LCP element. On most sites those few items are enough to move the metrics past their thresholds and produce a measurable result without launching a full engineering project. Anything beyond that should be planned only after the first phase has had time to appear in field data.
 LinkedIn

Keep reading
-
 Content & On-Page SEO
What Is E-E-A-T? Understanding Google’s Content Quality Framework
Content that is technically optimized for SEO, loads quickly, and targets the right search queries may still fall short of its expected visibility in search results. One key reason is that meeting technical criteria alone is not enough; the content must also demonstrate strong signals of experience, expertise, authoritativeness, and trustworthiness. E-E-A-T (Experience, Expertise, Authoritativeness, […]
-
Content & On-Page SEO
What Is Search Intent and How Do You Identify It?
You reached page one for your target keyword, impressions climbed, the graph in the report points up. But visitors bounce back after a few seconds and the form stays empty. More often than not this is not a ranking problem; it is the page offering something other than what the person who typed that query […]
-
Organic Search
Using Hreflang Tags on Multilingual Sites
A multilingual or multi-regional site holds more than one version of the same content. The search engine has to decide which of those versions to show to which user. The hreflang tag is the technical SEO implementation that defines this relationship. An incorrect or incomplete implementation produces two outcomes: users land on a page in […]